TECH Signal 499
Europe's free satellite service just made it easier to track wildfires
 ↗
↗
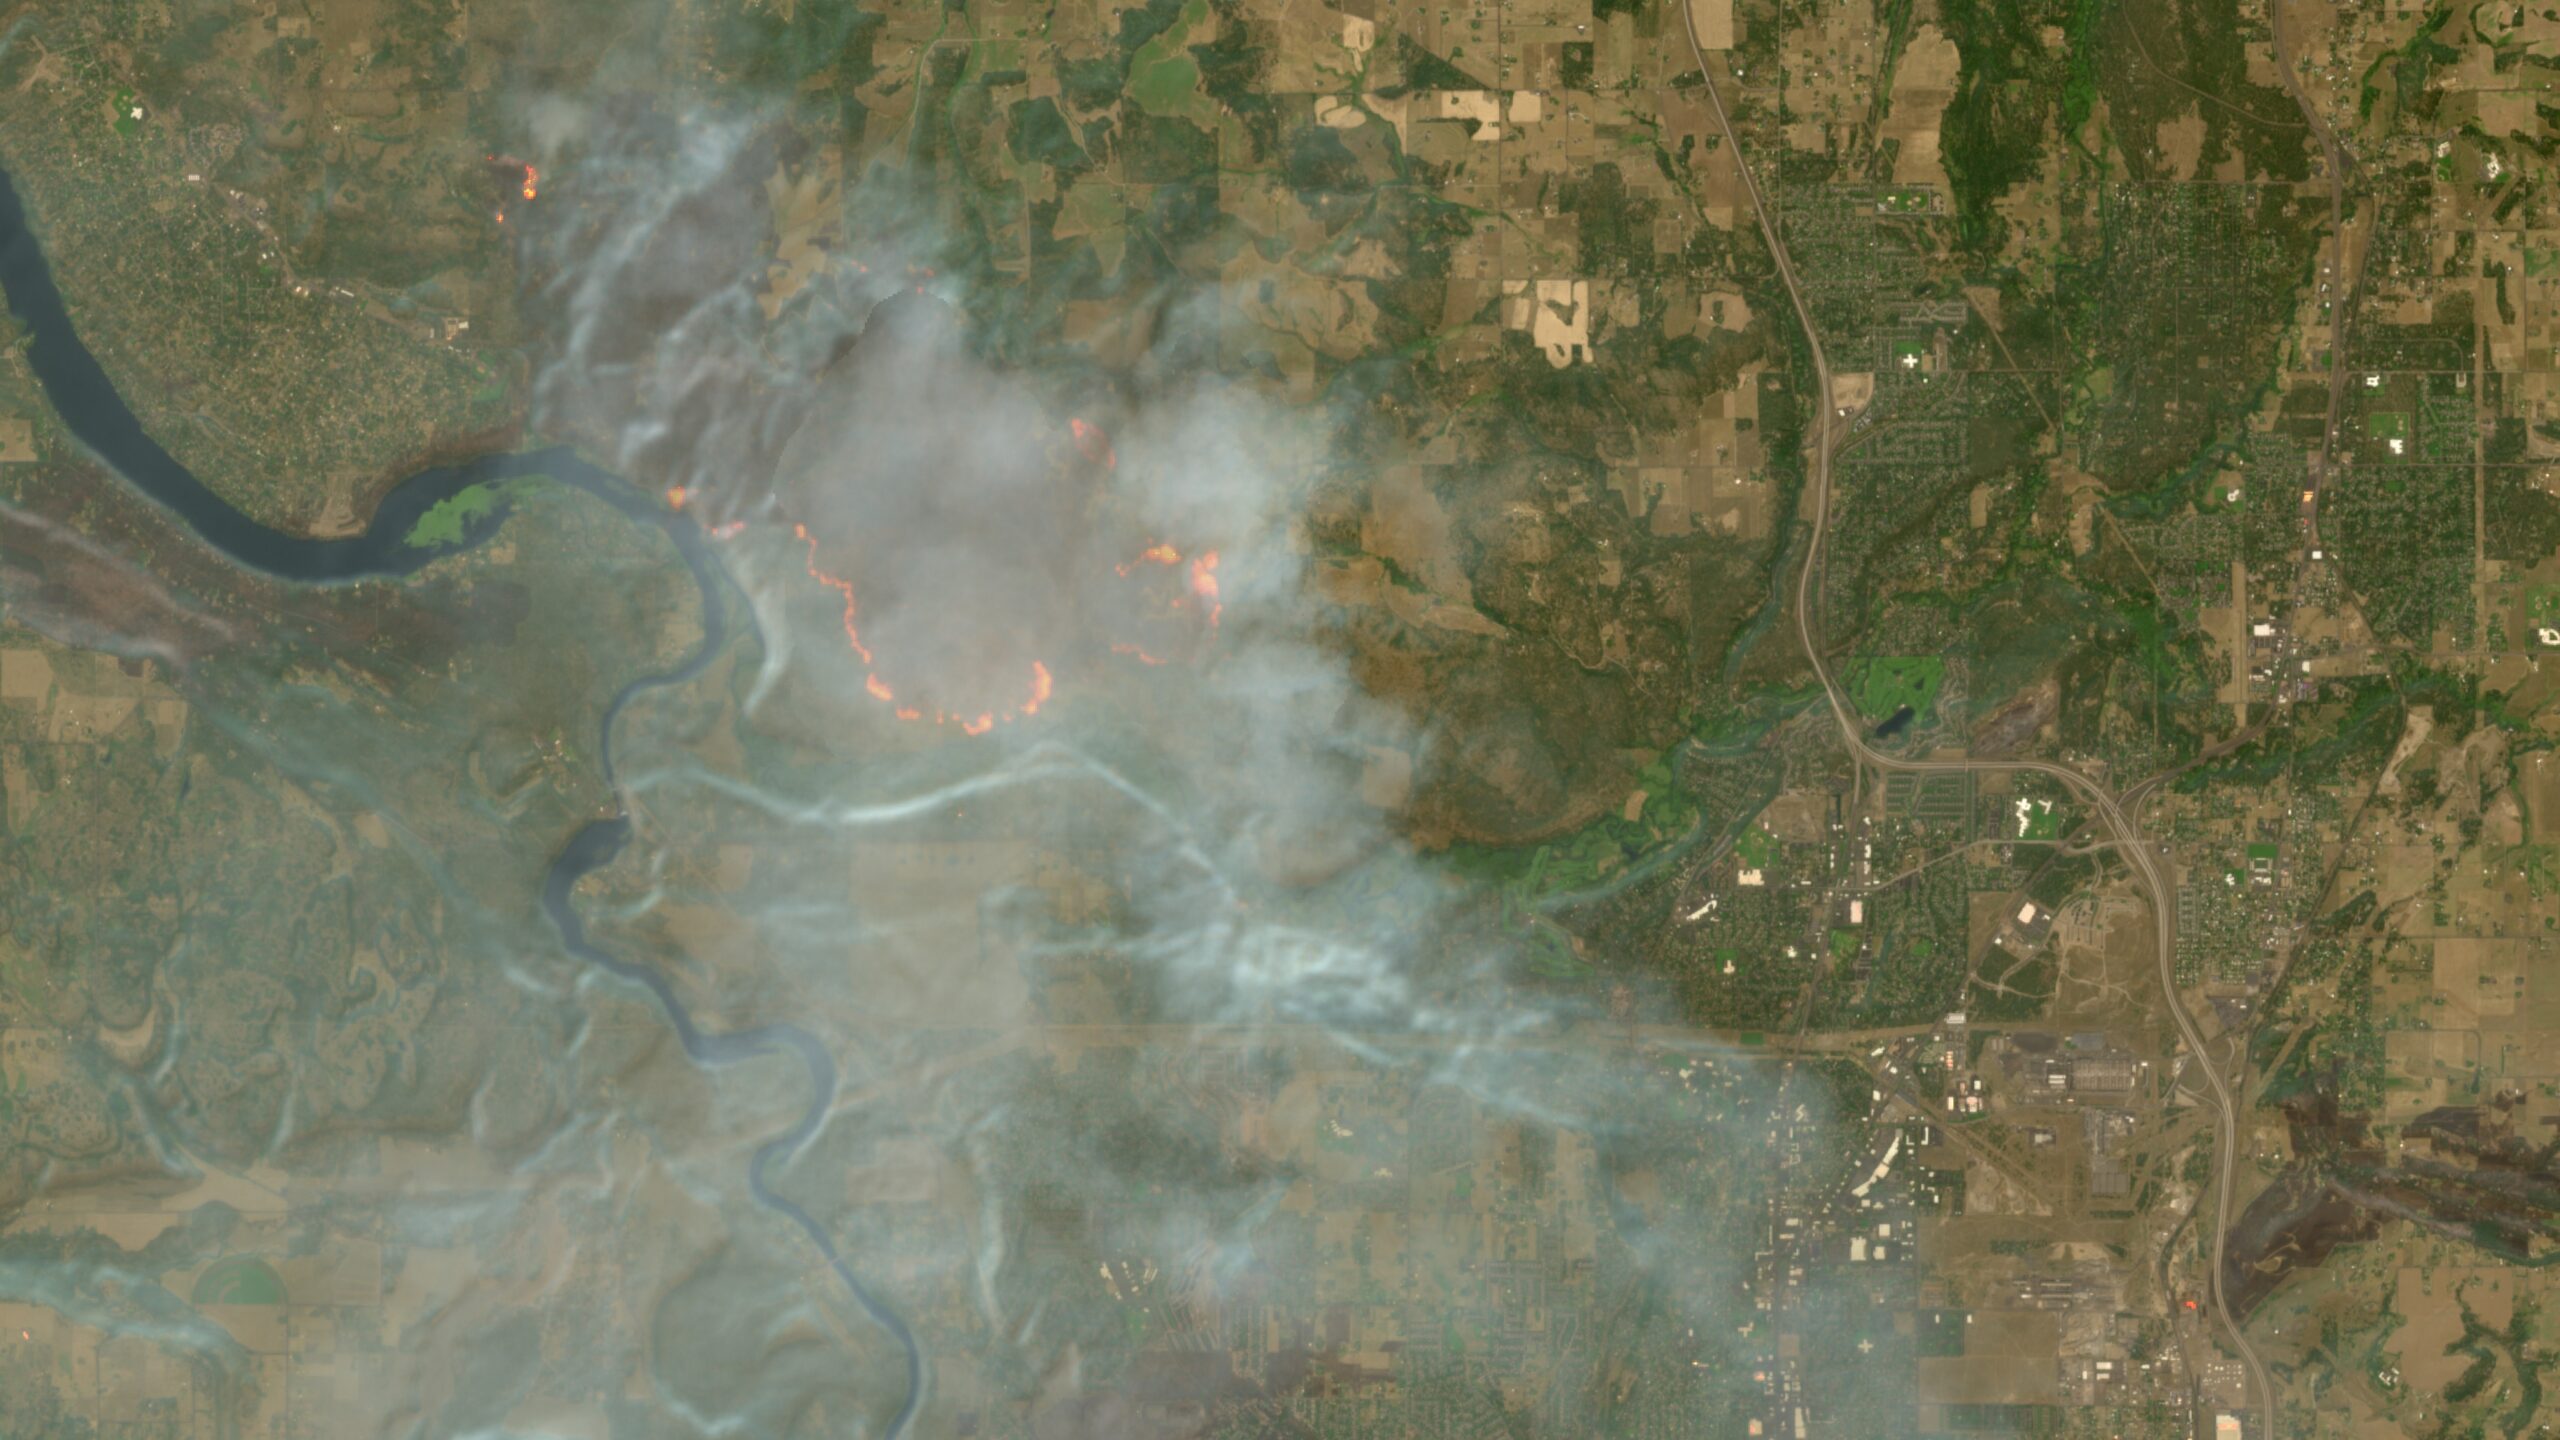
Europe’s Copernicus Browser now includes a default wildfire visualization layer for Sentinel-2 satellite imagery, simplifying real-time wildfire tracking for users.
Engineers and operators monitoring environmental conditions or disaster response can now access higher-resolution wildfire data without manual scripting. This reduces friction for real-time analysis but does not change the underlying satellite revisit frequency or resolution limits. The update makes existing data more actionable for non-specialists.
Written by elseif from the cluster below · every claim links back to a sourceThe three things worth knowing
The new default layer combines visible, near-infrared, and short-wave infrared bands to highlight active fires and burned areas.
Sentinel-2’s 10-meter resolution exceeds NASA’s FIRMS tool but updates less frequently (every few days).
Users previously had to manually apply the script; now it is integrated into the Copernicus Browser interface.
THE READ
What the cluster adds up to.
The change removes a technical barrier for engineers and analysts tracking wildfires. Previously, users needed to copy and paste a JavaScript script into the Copernicus Browser to visualize wildfire data. Now, the layer is available as a default option, eliminating the need for manual configuration. This lowers the skill threshold for accessing high-resolution satellite imagery, though it does not alter the satellite’s capabilities or data quality. The update is a usability improvement, not a sensor or algorithm upgrade.
The trade-off between resolution and revisit time remains unchanged. Sentinel-2 provides 10-meter resolution in key bands, which is finer than NASA’s FIRMS tool but updates only every few days. For applications requiring near-real-time monitoring, such as emergency response, this delay may still be a limitation. Engineers must weigh the need for detail against the need for frequency when selecting data sources. The new layer does not address this fundamental constraint.
The integration reflects a broader trend of making satellite data more accessible to non-experts. The script’s origin, developed by a remote sensing specialist and later adopted by the European Space Agency, shows how community contributions can shape official tools. However, the layer’s utility depends on the user’s familiarity with interpreting multi-spectral imagery. While the visualization simplifies fire detection, misinterpretation of the data (e.g., confusing burned vegetation with other land cover changes) remains a risk without proper training.
Climate change is increasing the demand for wildfire monitoring tools, and this update responds to that need. The layer’s availability in a free, public platform like Copernicus Browser ensures broader access, but it does not solve challenges like cloud cover obscuring satellite imagery or the limited coverage of high-resolution passes. For engineers building systems reliant on this data, the update reduces setup time but does not eliminate the need for complementary data sources or ground-truth validation.
Written by elseif from the cluster below · checked for specifics the sources never containedTHE CLUSTER