DATABASES Signal 169
PostgreSQL 19 adds four system views for lock, recovery, autovacuum scores, and DSM allocations
 ↗
↗
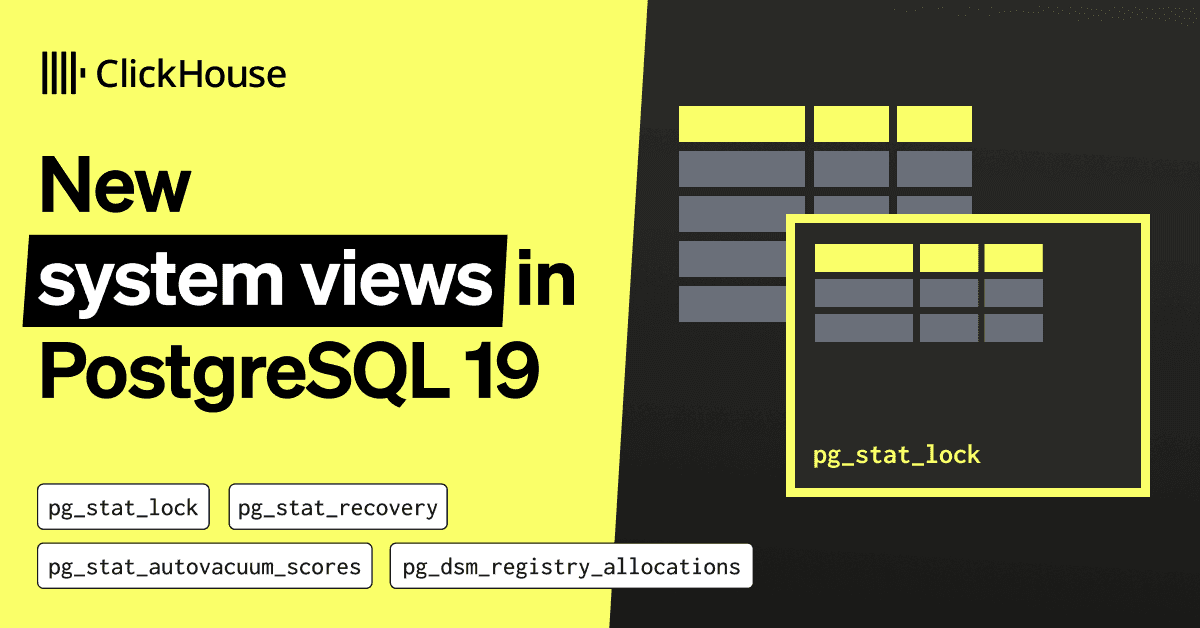
PostgreSQL 19 introduces pg_stat_lock, pg_stat_recovery, pg_stat_autovacuum_scores, and pg_dsm_registry_allocations to simplify monitoring of lock contention, recovery state, autovacuum priority, and dynamic shared memory usage.
Engineers can now query cumulative lock statistics and other runtime state directly from SQL instead of parsing logs or stitching together snapshots. The new views give a single source of truth for observability, reducing the operational overhead of custom monitoring scripts. Because the release is still in beta, column names may still change before the final GA release.
Written by elseif from the cluster below · every claim links back to a sourceThe three things worth knowing
pg_stat_lock provides cumulative, cluster-wide lock statistics per lock type, counting only waits longer than deadlock_timeout.
pg_stat_recovery, pg_stat_autovacuum_scores, and pg_dsm_registry_allocations expose recovery status, autovacuum priority scores, and dynamic shared memory allocation details respectively.
Statistics can be reset with pg_stat_reset_shared('lock'), a new reset target introduced alongside pg_stat_lock.
THE READ
What the cluster adds up to.
PostgreSQL 19 adds four new system views, pg_stat_lock, pg_stat_recovery, pg_stat_autovacuum_scores, and pg_dsm_registry_allocations, each designed to make inspection of specific internal states easier. The article notes that these views were highlighted in the release notes and that the last similar highlight occurred in PG13 and PG14. By exposing these metrics as SQL views, the database itself becomes a richer source of observability data.
The pg_stat_lock view replaces the need to combine pg_locks snapshots with log_lock_waits parsing for lock contention analysis. It returns one row per lock type and includes columns for the number of waits, total wait time, and fast-path exceedances, but only counts waits that exceed the deadlock_timeout (default one second). The view is a thin wrapper around the new pg_stat_get_lock() function, and its statistics can be cleared with pg_stat_reset_shared('lock'), a reset target added in this version.
The other three views each target a different subsystem: pg_stat_recovery reports the current recovery state, pg_stat_autovacuum_scores shows autovacuum priority scores, and pg_dsm_registry_allocations lists dynamic shared memory allocations. The article mentions that column names in these views have already been renamed mid-cycle, indicating they may still evolve before the final release. All four views are part of the beta release, so their schemas are not yet guaranteed.
Adopting the new views requires no additional configuration beyond running PostgreSQL 19; the views are available by default. However, engineers should be aware that pg_stat_lock does not count every lock wait, only those longer than deadlock_timeout, so it may not capture short-duration contention. Because the release is still in beta, any production deployment should test for potential schema changes and verify that existing monitoring pipelines can handle the new columns.
The new system views are only present in PostgreSQL 19 and later, so older installations cannot query them. The pg_stat_get_lock() function backing pg_stat_lock lacks its own documentation, meaning direct calls may be less portable. Finally, resetting statistics with pg_stat_reset_shared('lock') works only for the new lock target; other reset targets remain unchanged.
Written by elseif from the cluster below · checked for specifics the sources never containedTHE CLUSTER