TECH Signal 469
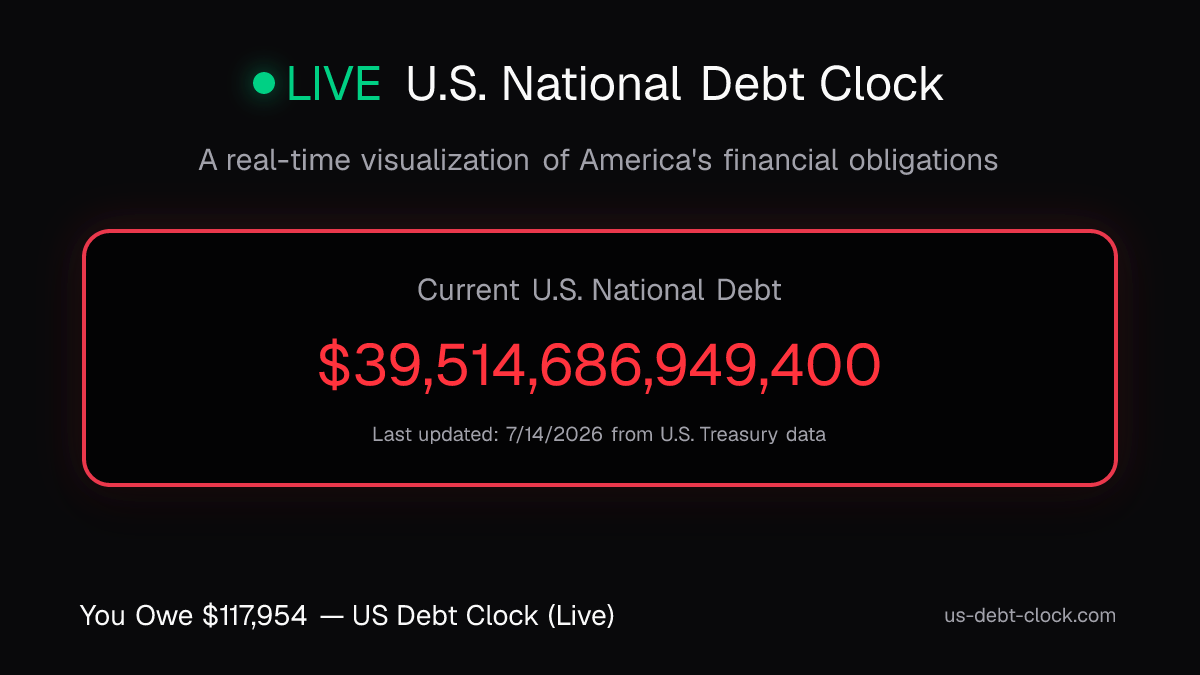
US national debt reaches $39.96 trillion with per-citizen share at $119,287
 ↗
↗
The US national debt has climbed to $39.96 trillion, equating to $119,287 per citizen, based on Treasury data projections.
For engineers building financial, economic, or policy-related systems, the scale and growth rate of US debt may influence long-term interest rates, inflation expectations, and fiscal stability assumptions. Real-time debt tracking tools now provide granular data that could inform risk modeling or public-sector software requirements.
Written by elseif from the cluster below · every claim links back to a sourceThe three things worth knowing
The US national debt stands at $39.96 trillion, updated in real-time using Treasury data projections.
Debt per citizen is calculated at $119,287, with daily increases estimated at $5 billion.
The debt grows by approximately $1 trillion every 750 days, with daily interest costs of $3.6 billion.
THE READ
What the cluster adds up to.
The US national debt has reached $39.96 trillion, a figure derived from official Treasury data and algorithmically projected between updates. This live counter provides a real-time snapshot of federal borrowing, breaking down the debt into per-citizen and per-taxpayer shares. For engineers working on financial platforms or economic modeling tools, this data offers a concrete baseline for stress-testing scenarios, such as inflationary pressures or interest rate volatility. The transparency of the underlying Treasury dataset also allows for integration into custom dashboards or risk assessment frameworks, though the projections between official updates remain estimates.
The debt’s growth rate, approximately $1 trillion every 750 days and $1.3 billion per day, highlights the accelerating pace of federal borrowing. This trajectory may impact software systems that rely on macroeconomic assumptions, such as pension fund calculators, municipal budgeting tools, or long-term infrastructure planning platforms. Engineers should note that the daily interest cost alone is $3.6 billion, a figure that could influence models for debt servicing or fiscal sustainability. However, the projections are based on observed trends and may not account for sudden policy shifts or economic disruptions, limiting their predictive accuracy.
The per-citizen and per-taxpayer breakdowns ($119,287 and $285,436, respectively) provide a tangible way to contextualize the debt’s scale. For developers building public-facing financial literacy tools or policy simulation software, these metrics could serve as key inputs for user engagement or educational features. The live counter’s reliance on Treasury data ensures credibility, but the methodology’s reliance on periodic updates means the displayed figures are interpolated between official releases. This introduces a small but inherent lag, which engineers should factor into time-sensitive applications.
The broader implications of this debt level extend to sectors beyond finance, including tech infrastructure supporting government operations. Systems managing federal procurement, tax collection, or social services may need to accommodate higher transaction volumes or more complex fiscal constraints. The debt clock’s granularity, such as state-by-state comparisons or historical trends, could also inform data visualization tools for policymakers or researchers. However, the absence of contextual analysis (e.g., GDP growth, revenue projections) in the raw data means engineers must supplement it with additional sources for comprehensive modeling.
Written by elseif from the cluster below · checked for specifics the sources never containedTHE CLUSTER