DATABASES Signal 311
What's new in ClickHouse Managed Postgres: Customer notifications, better observability, faster backups, extensions, and more
 ↗
↗
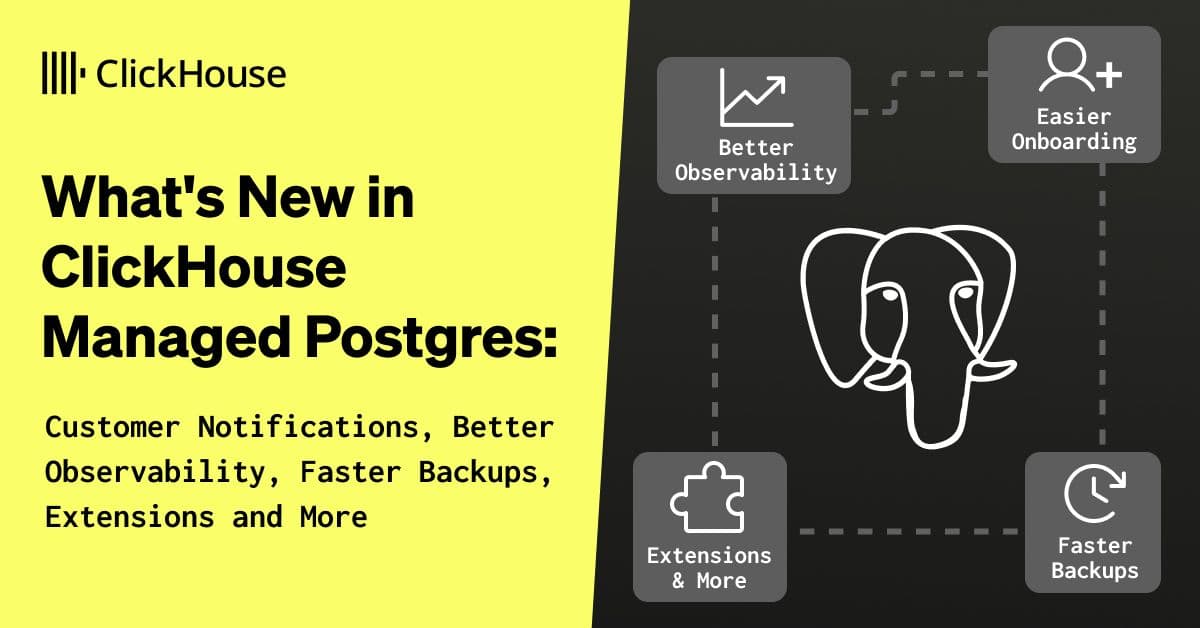
ClickHouse Managed Postgres adds proactive customer notifications, richer observability tools, faster backup performance, and broader extension support while refining the onboarding flow for a unified Postgres-ClickHouse stack.
Engineers gain early warning of storage pressure and can integrate Postgres health into existing monitoring pipelines without switching consoles. The backup and observability upgrades reduce operational overhead and make performance tuning more data-driven, though larger instances may see temporary CPU spikes during backup windows.
Written by elseif from the cluster below · every claim links back to a sourceThe three things worth knowing
Disk-usage alerts at 85% capacity are now sent via console, email, and optional Slack, with replica lag, uptime, and failover notices planned.
Observability includes a searchable log view, detailed metrics with per-table breakdown, a Prometheus-compatible endpoint, and an OpenAPI slow-query interface for programmatic access.
Backup speed improved on large servers by tuning wal-g to use more CPU and disk throughput, with a future shift to the Rust-based wal-rus for greater efficiency.
THE READ
What the cluster adds up to.
The onboarding experience has been redesigned to let users load sample data or migrate existing PostgreSQL databases through ClickPipes, query immediately with the built-in SQL console, sync to ClickHouse in a few clicks, and enable unified querying via pg_clickhouse. This reduces the steps required to start using the managed service and to combine OLTP and OLAP workloads.
Customer notifications now trigger when a Postgres service’s disk usage stays above 85% of capacity, delivering alerts in the console, by email, and optionally through Slack. Users can configure notification channels per service, and upcoming alerts will cover replica lag, uptime, and failover events, giving engineers earlier visibility into operational health.
Observability has been expanded with a logs view that supports full-text search, severity, and time-range filters, and a refreshed metrics pane that shows CPU, memory, disk, IOPS, connections, and per-table storage usage. Query insights provide real-time latency and throughput data, while a Prometheus-compatible /metrics endpoint and an OpenAPI slow-query API allow existing monitoring stacks and custom tooling to ingest Postgres signals programmatically.
Backup performance was increased by adjusting the wal-g configuration to leverage additional CPU and disk throughput on larger server sizes, making backup and restore times predictable even for 10+ TB datasets. This change can cause temporary CPU spikes, but PostgreSQL workloads retain priority. Future work aims to replace parts of wal-g with the Rust-based wal-rus for more efficient backups, and extension support has been broadened with the addition of the re2 extension.
Written by elseif from the cluster below · checked for specifics the sources never containedTHE CLUSTER