OBSERVABILITY Signal 279
Whats new in ClickStack - June + July
 ↗
↗
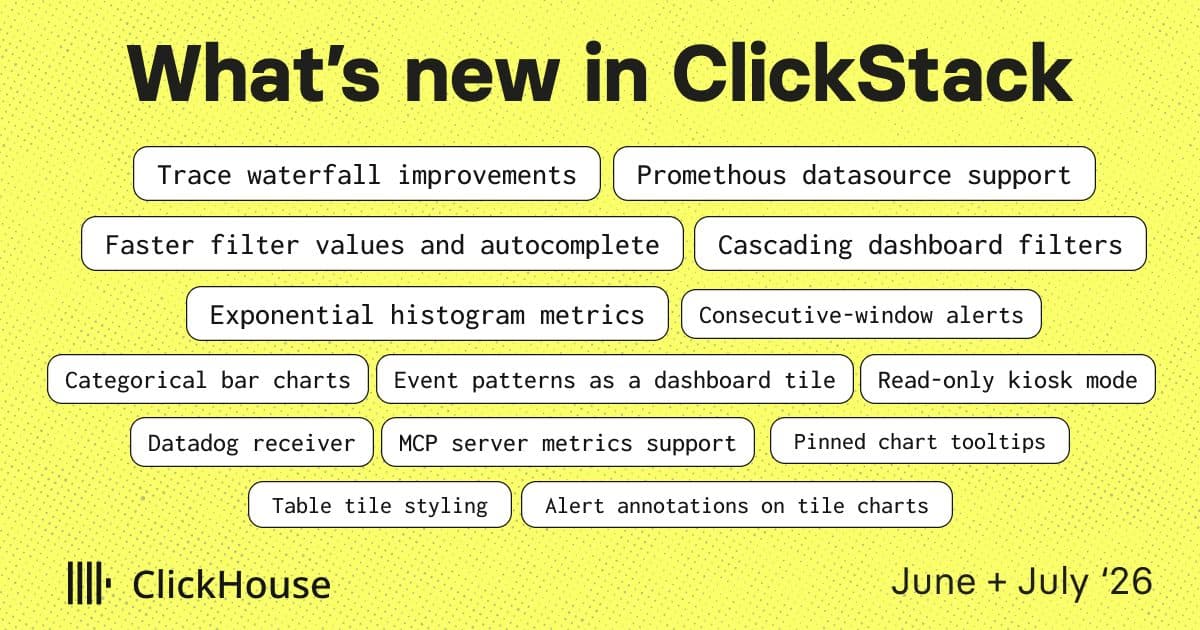
ClickStack’s June-July release adds richer trace navigation, Prometheus ingestion, exponential-histogram quantiles, and smarter dashboard filtering.
Engineers will see faster, more precise trace exploration thanks to stable service colors, a minimap, and clickable span links, reducing time spent locating issues. The new Prometheus connector and exponential-histogram support let existing Prometheus workloads be ingested without a separate stack, simplifying architecture. Dashboard filters now interact like faceted search, and read-only kiosk mode eases display-only use cases, improving operational ergonomics.
Written by elseif from the cluster below · every claim links back to a sourceThe three things worth knowing
Trace UI now shows consistent service colors, a minimap for large traces, and a panel that surfaces OpenTelemetry span links.
Metrics can be pulled from external Prometheus-compatible sources and exponential histograms now expose quantile calculations with a slimmer default schema.
Dashboard filters can narrow each other, event patterns appear as a tile type, and filter autocomplete uses ClickHouse text indexes where they exist.
THE READ
What the cluster adds up to.
The trace viewer received several usability upgrades. Each service in a waterfall now has a fixed color bar, making it easier to differentiate components at a glance. A minimap above the waterfall displays the full trace range and lets users zoom or pan by dragging, which solves the problem of losing context when focusing on a subsection. Span links from OpenTelemetry are now rendered in the detail panel, allowing direct navigation to related traces without manual ID lookup.
Metrics handling was broadened beyond ClickStack’s native store. Users can point the system at any Prometheus-compatible endpoint, enabling hybrid observability setups and easing migration from pure Prometheus stacks. Exponential histogram data now supports quantile queries, giving more expressive statistical insight without extra processing. The default metric schema was trimmed to reduce storage overhead, though existing schemas will need to be migrated if they rely on the removed fields.
Dashboard interaction was refined to behave more like a faceted search engine. Filters now affect each other, so selecting one value narrows the options in other filters, which can reduce the number of irrelevant results shown. A new tile type displays recurring event patterns, and kiosk mode locks dashboards into a read-only view suitable for wall displays. Autocomplete and dropdown lists now pull values from ClickHouse text indexes when available, improving response time compared with full table scans.
Adopting these features does not require code changes, but operators must enable the Prometheus connector and ensure their Prometheus endpoints expose compatible metrics. The text-index-based autocomplete only works where those indexes have been defined, so environments lacking them will fall back to slower scans. The leaner default schema may require schema migration for legacy dashboards that reference removed columns.
Overall, the release focuses on making trace analysis more intuitive, extending metric ingestion options, and tightening dashboard usability. For teams that already use ClickStack, the upgrades should be drop-in with minimal configuration, but they need to verify that their Prometheus sources and text indexes meet the new requirements to avoid regressions.
Written by elseif from the cluster below · checked for specifics the sources never containedTHE CLUSTER